As we head into a new year, it’s typical for podcast hosts and reporters to ask professional economists for their macro outlook. Since I’ve given several such interviews in the last week, I thought I would summarize some of my key points here, in written form. In this post I’ll talk about the yield curve and the Fed, and in the next I’ll talk about the impact of AI.
The Yield Curve Uninverted—And This Time, We Mean It
Of the various recession indicators, the one I like the best is the yield curve—specifically, the spread between the 10-year and 3-month Treasury. In this formal academic article, my co-author Ryan Griggs and I present the merits of this tool: Properly defined, the yield curve has inverted before every recession, and there have been virtually no false positives either. (Griggs and I link this empirical pattern to the theory of the business cycle developed by Austrian School economist Ludwig von Mises.)
The following chart shows how the spread between the 10-year and 3-month went negative before every recession (gray bars) over the last 40 years:
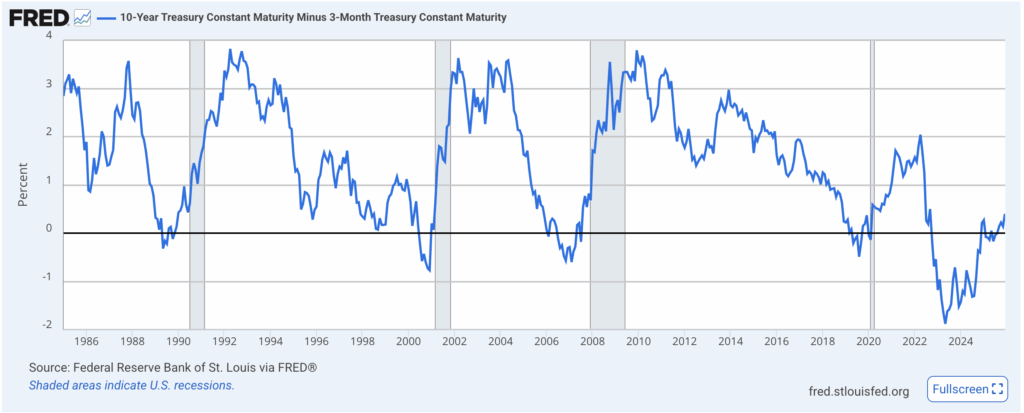
(The actual pattern goes back decades further, but this particular data series from FRED doesn’t.)
As the chart shows, if history is any guide, we should expect a recession in the near future. However, I am hesitant to be more specific on the timing, because this cycle has been the most protracted on record. As the chart clearly demonstrates, the most recent inversion lasted much longer than in prior cycles. Moreover, once the curve uninverted in December 2024, it looked like the old pattern was finally reasserting itself, but then the curve inverted again.
Having said all that, this time it really does seem that we are back in “normal” territory. With the Fed announcing a halt to its balance sheet shrinkage (more on that in the next section), and the markets expecting at least two further rate cuts in 2026, we should get a combination of sinking short-term rates and upward pressure on longer rates because of inflation expectations. This should push the blue line in the chart ever higher (as the spread between the 10-year and 3-month Treasuries continues to grow) as we progress through 2026.
Fed Balance Sheet Action
In its late October announcement, besides cutting its target for the federal funds rate—down to a range of 3.75% – 4.00%—the Fed disclosed some significant changes to its balance sheet management:
Effective October 30, 2025, the Federal Open Market Committee directs the Desk to:
…
o Roll over at auction the amount of principal payments from the Federal Reserve’s holdings of Treasury securities maturing in October and November that exceeds a cap of $5 billion per month. Redeem Treasury coupon securities up to this monthly cap and Treasury bills to the extent that coupon principal payments are less than the monthly cap. Beginning on December 1, roll over at auction all principal payments from the Federal Reserve’s holdings of Treasury securities.
o Reinvest the amount of principal payments from the Federal Reserve’s holdings of agency debt and agency mortgage-backed securities (MBS) received in October and November that exceeds a cap of $35 billion per month into Treasury securities to roughly match the maturity composition of Treasury securities outstanding. Beginning on December 1, reinvest all principal payments from the Federal Reserve’s holdings of agency securities into Treasury bills. [Federal Reserve statement on monetary policy, bold added.]
As of December 1, the Fed halted the shrinkage of its balance sheet that had been in effect since mid-2022:
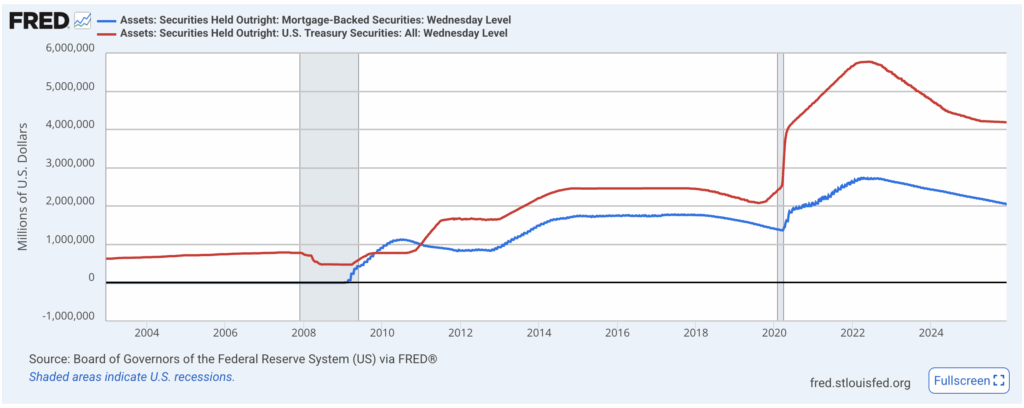
However, the Fed is planning on reinvesting all of the maturing MBS (blue line) into T-bills (red line). Along with the GENIUS Act’s in-built demand for T-bills, here too we see another potential $2 trillion in the coming years. However, if the Fed does indeed divest itself of MBS, that could put even more pressure on home prices, adding to the impact of the rapid rise in mortgage rates in 2022-2023.
Conclusion
The Fed has fully reversed course in the sense that it is cutting rates and has halted the shrinkage of its balance sheet (though its MBS component is still going to roll off). This should further drive the yield curve back into “normal” upward-sloping territory, which presumably means a serious slowdown, if not an outright recession, is in store in the latter half of 2026.
In the next post I’ll go into more detail about the impact of AI on US productivity and the labor market.
Dr. Robert P. Murphy is the Chief Economist at infineo, bridging together the dependability of Whole Life insurance policies with the benefits of blockchain-based finance.
Twitter: @infineogroup, @BobMurphyEcon
Linkedin: infineo group, Robert Murphy
Youtube: infineo group
To learn more about infineo, please visit the infineo website