In my last post, I documented the rise in grocery prices over the last three decades (even in terms of “official” government statistics), but I didn’t offer any explanation for the increase. In the present post, I’ll show the growth in the money supply that helps explain it. (For those preferring a verbal commentary, I cover this material in a recent InFi episode as well.)
M2 versus Food at Home Price Index
The following chart shows (indices of) the M2 money supply versus the BLS’ food at home price index:
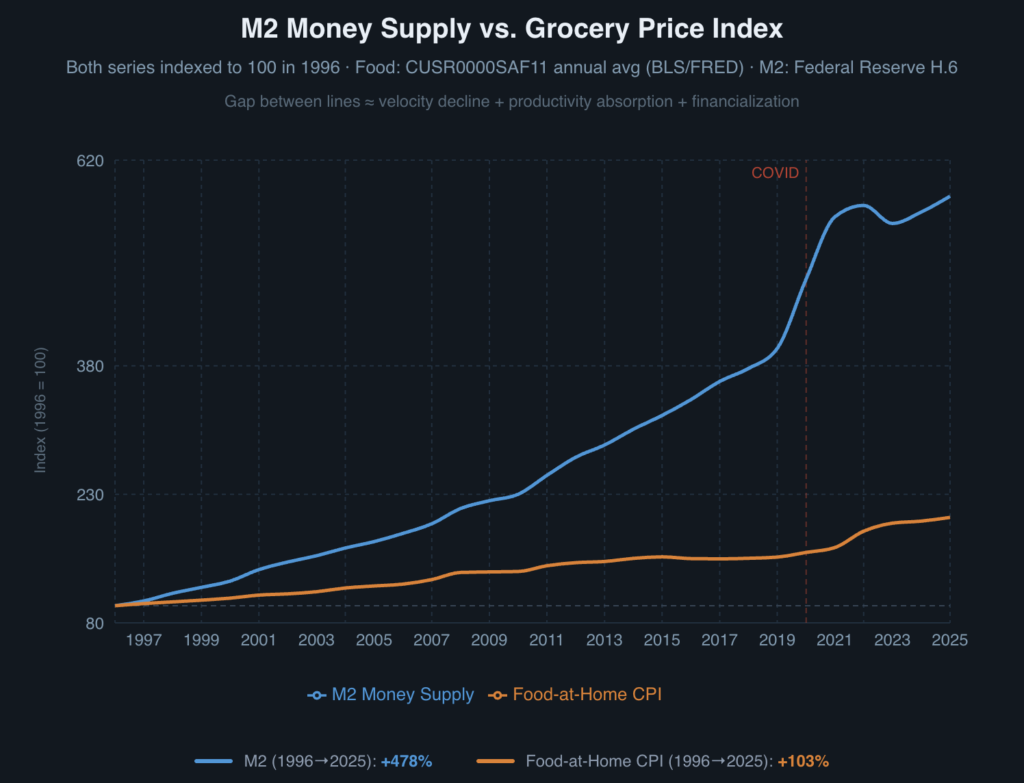
As the chart shows, not only do the two series generally move up, but there is a similarity in their patterns. We can also tie each line to one of the y-axes (using an OLS best fit) to product the following chart:
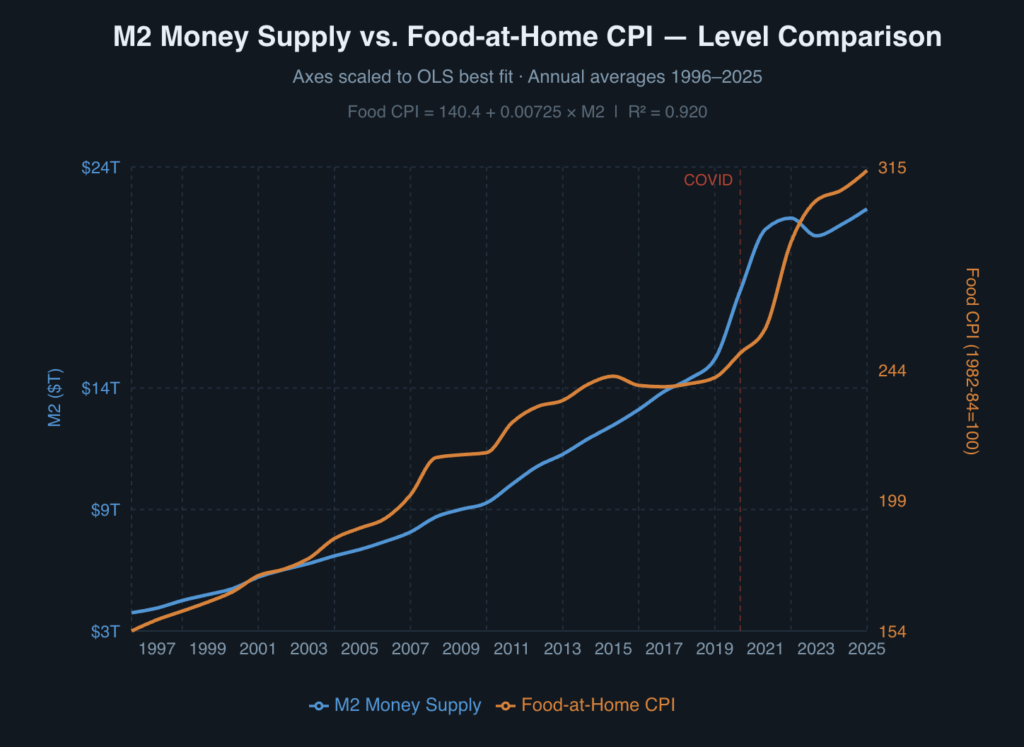
Now to avoid confusion: I am not saying that there is a simple, one-for-one relationship between money and grocery prices. In the 30-year stretch we’ve been analyzing, the M2 monetary aggregate more than quintupled, whereas the grocery food price index only doubled.
However, what I think this demonstrates is that the normal mechanism of the market economy would lead to falling prices over time. In other words, if we held the stock of money constant (so that there were the same total number of dollars in the economy), then as the amount of “stuff” produced increased year after year, the unit price of each item would have a tendency to fall. Also, a rising population provides an additional reason that the community could hold a rising stock of money without pushing prices up. Therefore, in order to see grocery prices actually rising over time, we would expect the quantity of money to rise even faster—exactly what we do see.
The surge in M2 and grocery prices following Covid is another indication that we’re on the right track. In contrast, explanations like “corporate greed” don’t really work—did grocery stores suddenly become greedier from 2020 – 2023?
The Sources of M2 Growth
As I explained in the podcast episode, the sources of M2 growth are complex. It’s not simply the government printing up more $20 and $100 bills. In fact, a large component is new loans advanced by private commercial banks. This is a detailed process, where professional economists have fierce disagreements over emphasis and even causality, so I won’t try to referee those disputes here. The advanced reader can check out this series of posts (one, two, and three) where I get into some of the intricacies of how new money is actually created in our current financial framework.
Conclusion
To sum up our findings: People like me who began caring about grocery prices in the 1990s (or earlier) aren’t imagining things: They really are much higher today, having more than doubled (even according to the rosy government statistics) in the last thirty years. Furthermore, they shot up more than 25 percent (cumulatively) just in the three years following the Covid lockdowns.
There are lots of moving parts in the economy, and to explain the specific movements of grocery prices over decades would require detailed analysis. However, one necessary component was the massive growth in the stock of money (measured for example by the M2 aggregate) over the same period. Not only does this match the general rise, but the timing also lines up with the Covid surge.
Dr. Robert P. Murphy is the Chief Economist at infineo, bridging together the dependability of Whole Life insurance policies with the benefits of blockchain-based finance.
Twitter: @infineogroup, @BobMurphyEcon
Linkedin: infineo group, Robert Murphy
Youtube: infineo group
To learn more about infineo, please visit the infineo website