Earlier this month (March 2) fans of the Austrian School noted the 100th anniversary of the birth of Murray Rothbard. He wrote books on topics ranging from a five-volume series on American colonial history to a treatise on libertarian political philosophy, but Rothbard was first and foremost a trained economist. In this post I’ll review one of my favorite contributions in his magnum opus, Man, Economy, and State, namely a diagram that I told my undergrad students was the Austrian analog of the textbook “circular flow diagram” of more conventional classes.
The Mainstream “Circular Flow Diagram”
To appreciate the sophistication of Rothbard’s diagram, let me first explain the more typical one you might see in an introductory economics course:
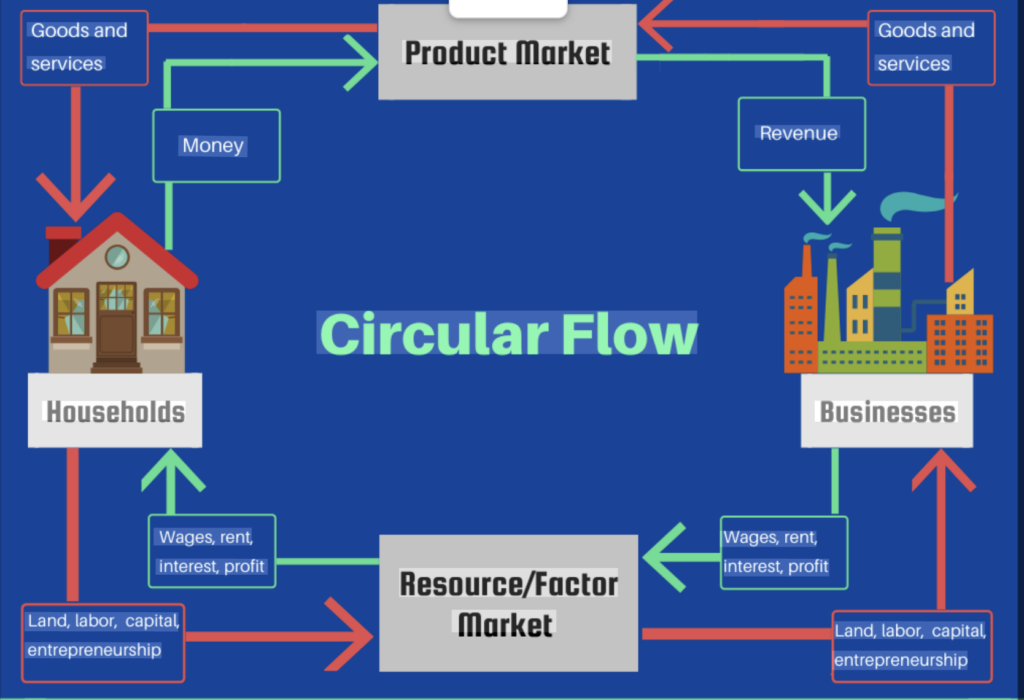
In the diagram above, money moves clockwise (green arrow) around the diagram. Specifically, households spend money buying products (and services) in the market, which flows as revenue to the businesses. The businesses in turn spend money buying resources and hiring factors of production, which flows as wages, rent, interest, and profit to the households.
The red line moves clockwise around the diagram, showing the flow of factors of production (land, labor, capital, and entrepreneurial services) from the households to the businesses, which use those inputs to create the goods and services flowing to the households.
This simple “circular flow diagram” captures two important insights: First, that the finished goods and services businesses sell to households, are ultimately produced by the factors that households supply to the businesses. Second, one person’s expenditure is another person’s income.
Rothbard’s “Stages of Production” Diagram
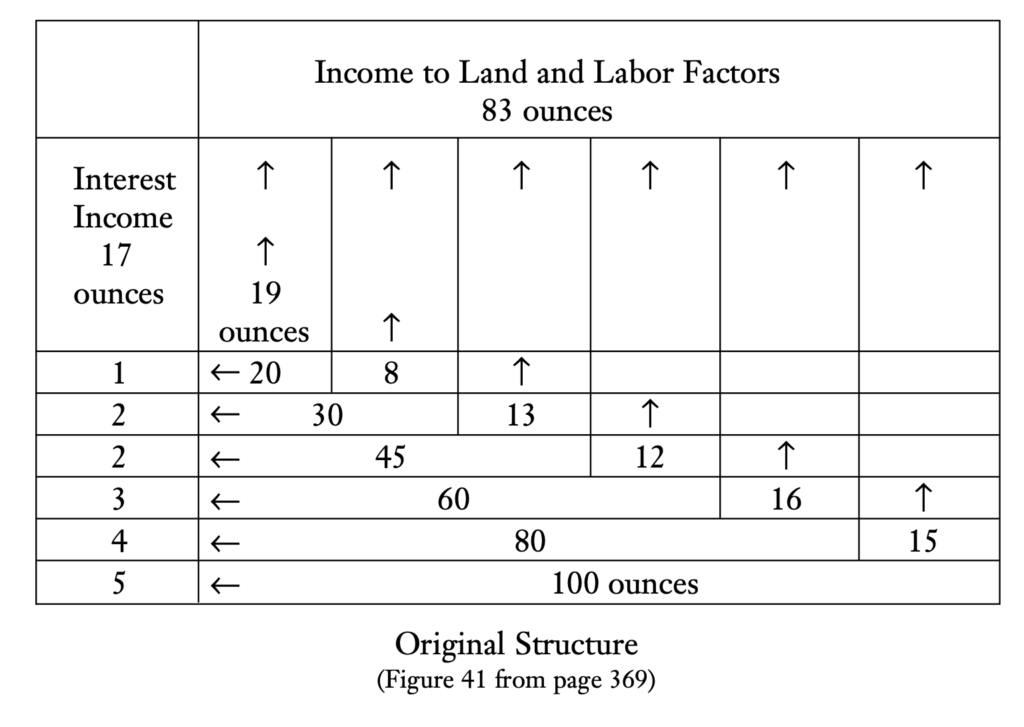
In contrast to the mainstream circular flow diagram, the Austrian analog showcases the “structure of production,” in which factors of production flow into various stages, which then move one step closer to the ultimate consumer. The following diagram comes from page 369 in Man, Economy, and State:
To avoid confusion: Rothbard didn’t invent the idea of stages of production. It goes back to Carl Menger (founder of the Austrian School with his 1871 book), and was elaborated upon by Eugen von Böhm-Bawerk in the 1880s. Friedrich Hayek had a similar diagrammatic exposition of “Austrian” capital theory in his Prices and Production (e.g. see p. 239 here), but that work is famously difficult to digest. Rothbard’s exposition is far easier for the newcomer.
In the diagram above, the bottom row shows the finished consumer good, the stock of which sells for a total of 100 ounces of gold. Let’s suppose it is loaves of bread at the grocery store. In that case, to understand where the loaves came from, we need to start at the beginning, i.e. the top of the diagram. Here, landowners are paid 19 ounces to plant wheat. One period later, they deliver the wheat to the capitalist who advanced them the 19 ounces of gold.
The capitalist then sells the wheat for 20 ounces to the next capitalist in line. In addition to paying the 20 ounces of gold for the raw wheat, this entrepreneur also pays 8 ounces of gold to hire the services of a miller, who grinds the wheat into flour.
A period later, the capitalist takes the flour and sells it for 30 ounces of gold to the next stage capitalist, who also pays an additional 13 ounces of gold to hire the services of a baker to turn the flour into uncut loaves of bread. Etc.
Now that I’ve explained how to read the diagram, note some interesting properties. At each stage, the arrows pointing upward show the payments accruing to the owners of land (natural resources) and labor. The arrows pointing left show the payments accruing to capitalists, as interest on their invested capital. For example, consider the capitalist who spends 30 ounces of gold buying flour, and spends an additional 13 ounces hiring the baker. He has advanced 30+13 = 43 total ounces of gold. A period later, he sells the finished bread (which still has to be cut and packaged for retail) to the next stage capitalist for a total of 45 ounces of gold. The difference between his investment and his revenue flows as interest on his invested capital. In other words, he invests 43 and sells a period later for 45, which is why 2 ounces of gold flow to the left in the diagram. (Rothbard chose his numbers so that, at each stage, the capitalist would earn roughly 5 percent on his investment. The numbers aren’t perfect because of rounding.)
If we assume that each stage occurs repeatedly, the whole system settles into a steady rhythm where 100 ounces’ worth of bread pops out at the end every period. The community as a whole earns exactly 100 ounces of income each period; the capitalists earn 17 ounces total while the land and labor owners earn the other 83 ounces. (You can sum the left- and upward arrows across all the stages to verify this.)
So What?
The reason I prefer the Austrian diagram is that it is richer than the circular flow. The Austrian stages of production approach captures everything the mainstream diagram does, but it also shows the time element. In our example, many periods must pass before the planting of wheat yields nicely sliced and packaged loaves of bread at the supermarket.
Finally, the Austrian approach shows the importance of gross investment every period, to keep the system running. In a mainstream textbook, our simply economy would be described as relying 100 percent on “consumer spending.” In other words, 100 percent of real GDP would consist of retail bread output. The 100 ounces spent by consumers on the bread at the grocery store would account for all income in the economy.
Yet the Austrian diagram shows how misleading this is. Each period, the capitalists at the various stages must reinvest a total of 318 ounces of gold into their businesses, in order to perpetuate the cycle. For example, if the capitalist who sells the flour for 30 ounces of gold were to consume all of his revenue (i.e. not just his net income of 2 ounces), failing to reinvest the usual 28 that he normally spends at the start of each period, then a “hole” would enter the pipeline. A few periods later, the finished loaves of bread wouldn’t arrive at the grocery store, because of the capitalist’s failure to invest several periods earlier.
This type of disturbance is the essence of the Austrian theory of the business cycle. Mainstream models—which do not include a structure of production—can’t even handle such a possibility in their simplistic framework. That’s why Keynesian economists can simply recommend, “People need to spend more!” when the economy stumbles, whereas for the Austrians there were “real” malinvestments in the past that must now be rinsed out of the system.
Conclusion
If my discussion has piqued the reader’s interest, I encourage checking out a collection of Rothbard’s “pop” essays in economics, and then moving on to Man, Economy, and State—along with my Study Guide.
Dr. Robert P. Murphy is the Chief Economist at infineo, bridging together the dependability of Whole Life insurance policies with the benefits of blockchain-based finance.
Twitter: @infineogroup, @BobMurphyEcon
Linkedin: infineo group, Robert Murphy
Youtube: infineo group
To learn more about infineo, please visit the infineo website