In a recent episode of the InFi podcast, I pushed back against the popular claim that institutional buyers of residential real estate were the primary drivers of surging home prices. In contrast, I said that the Federal Reserve was a much more plausible culprit. In the present post, I’ll showcase three charts to make my point in graphical form.
Home Prices: What Needs to Be Explained
The first chart shows the Case/Shiller national Home Price index, adjusted for the Consumer Price Index:
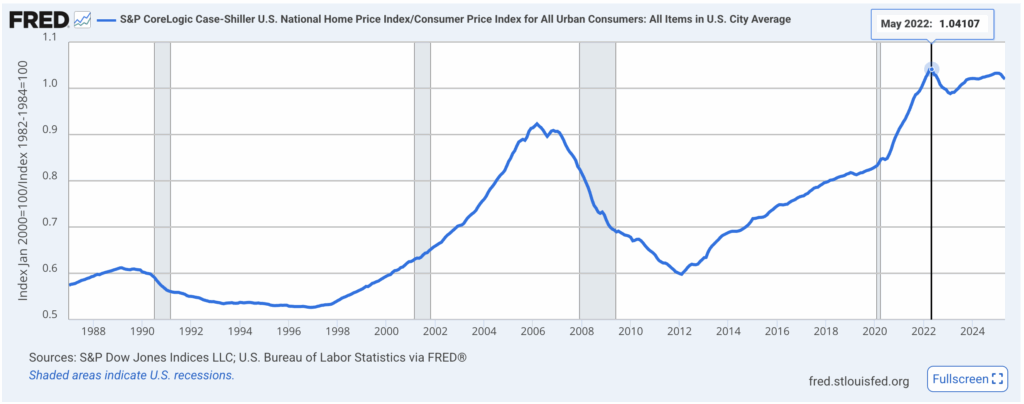
As the chart shows, once you take into account the general price level, you see that home prices surged during the Covid era, but peaked in May 2022. One of the points I made in the podcast episode was that it’s hard to explain this rollercoaster chart by reference to vague forces like “corporate greed” or “Blackstone buying residential homes.” After all, it’s not that corporations saw a big spike in their greediness from 2020-2022, but then had a visit from the Ghost of Foreclosures Future and decided to be altruistic.
Mortgage Rates
We can find a much more detailed causal mechanism by looking at mortgage rates:
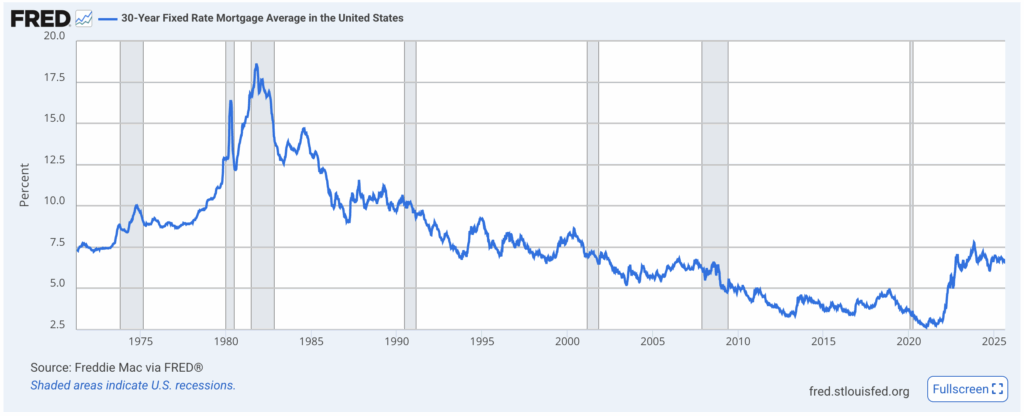
(Be careful reading the above chart: the y-axis doesn’t start at 0 percent and I couldn’t change the default setting—one of FRED’s major failings in my book.)
Consistent with its “easy money” policy of the Covid era, the Fed pushed down 30-year mortgage rates to historic lows in the early 2020s, but then they soared along with the Fed’s tightening of short-term rates in its effort to arrest consumer price inflation. Notice that the movement of mortgage rates dovetails with the pattern of home prices shown in the first graph.
Mortgage-Backed Securities
Finally, consider the Fed’s holding of mortgage-backed securities (MBS):
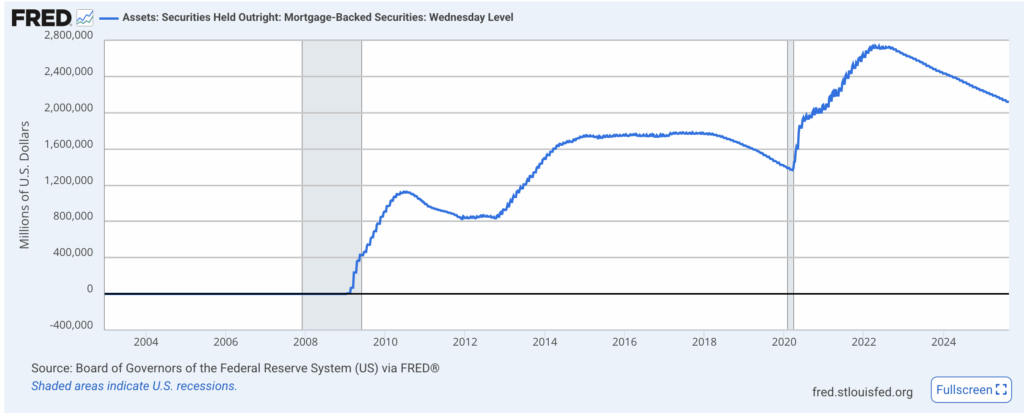
Again, this chart dovetails quite nicely with the movement in home prices. The Fed loaded up on MBS when the Covid crisis struck, but then let its holding began to gently unwind in early 2022.
Conclusion
In my book Understanding Money Mechanics, I devote one chapter (8) to explaining the general theory of the Austrian explanation for the business cycle, and then I spend another chapter (11) applying the theory to the case of the 2004-2007 US housing bubble. Even for people who look to other factors as the primary cause of the housing bubble of the mid-2000s, most people concede that the Fed played at least a supporting role.
As the charts above show, I think it is fair to lay at least some of the blame for the more recent surge in home prices on the Fed. By locking people in the homes while (electronically) printing boatloads of new money, the government/Fed acted in concert to drive up the price of residential real estate.
Dr. Robert P. Murphy is the Chief Economist at infineo, bridging together Whole Life insurance policies and digital blockchain-based issuance.
Twitter: @infineogroup, @BobMurphyEcon
Linkedin: infineo group, Robert Murphy
Youtube: infineo group
To learn more about infineo, please visit the infineo website